Looking at Signatures on a parliament.uk Petition
In January 2017, a petition was created at the UK Parliament petitions site with the title Prevent Donald Trump from making a State Visit to the United Kingdom. The petition became very popular, and by the time I noticed, it had 1.3M signatures. I took at look at the petition and noticed that the signature count was changing. There is some Javascript in the page that polls a JSON file that returns the current signature count. The DOM is then updated with the new count.
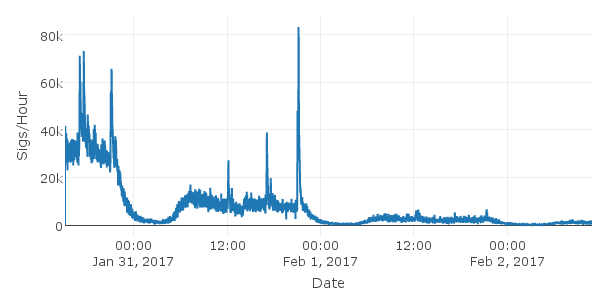
Since the data was changing so fast, I wondered just how many signatures were. I wrote a short bash script, the petition counter page on GitHub and hacked together a quick graph using the Plot.ly Javascript graphing library. The script repeatedly requests the JSON data and stores it in a file, creating a JSON array. The HTML file contains some Javascript that loads the JSON array, converts the data for presentation in Plot.ly. In addition, a new dataset of the rate of signatures is created from the timestamped signature counts.
You can browse the signature data for Petition 171928. Note that the graphs are interactive, so you are able to zoom and pan the data. The most interesting part of the data is at the beginning of the set. There is an obvious sogging of of signatures in the night time, and some peaks which I presume to be caused when another well followed twitter user tweeted about the petition.
A section of the rate data can been seen here:


